

River Turbidity Monitoring That Follows a Sediment Plume Downstream


Key Takeaways
Track the event, not the average. Sediment moves in pulses after rain, earthworks or dredging, so a continuous turbidity record shows when a plume arrived, how high it peaked and how long it lasted.
Pair an upstream reference with a downstream probe. Comparing the two separates what a construction site or outfall adds from what the catchment was already carrying.
Choose the measuring range for storm peaks. River water swings from nearly clear to heavily loaded within hours, so an automatic range or a wide fixed range keeps the top of the event on the chart.
Mount the sensor head in moving, mixed water. Readings taken in a still backwater or against the bed describe the mounting spot rather than the river.
Set alerts on change as well as level. A sharp rise against the upstream reference is often the earliest useful warning, well before a fixed limit is crossed.
Sediment Events Follow a Sequence, and the Sequence Runs Fast
Most sediment problems in rivers unfold in the same order. Rain loosens exposed soil, runoff carries it into gullies, drains and culverts, and a cloudy plume enters the channel and travels downstream with the flow. River turbidity monitoring exists to record that sequence as it happens, at the places where it matters, instead of reconstructing it later from a bottle filled once the water has already cleared.
The order matters because each stage has a different owner. A builder answers for the silt fence, a council for the drains and creek, a utility for the intake downstream. When a plume passes unrecorded, each party is left guessing whether the cloudy water came from its own patch or from someone else's.
Ellenex addresses this with its River and Waterway Turbidity Monitoring solution, a battery-powered optical sensor that measures turbidity in place and sends readings over LoRaWAN or cellular networks to the Ellenex Software Platform. It forms part of the wider Ellenex approach to water infrastructure monitoring.
This article stays with natural rivers, streams and urban waterways during sediment events: construction runoff, storm response and long-term catchment health. Filtration and coagulation performance inside treatment units is a separate job, covered by the Ellenex turbidity solution built for treatment units at remote industrial sites.
Plumes Nobody Recorded: What Unmeasured Sediment Costs
Permit and compliance disputes. Construction and dredging permits often set turbidity limits relative to background conditions. Without a continuous record from upstream and downstream, a contractor cannot show it stayed within limits, and a regulator cannot show it did not.
Habitat damage that shows up later. Fine sediment settles into gravel beds, smothers spawning areas and blocks light for aquatic plants. By the time the damage is visible, the event that caused it is long gone.
Intake and treatment upsets. A plume that reaches a raw water intake unannounced can overload screens, settling tanks and filters, and forces operators into reactive changes instead of planned ones.
Wasted sampling effort. Crews sent out on a fixed schedule tend to sample clear water on calm days and miss the short, intense peaks that carry most of the sediment load.
Erosion controls that fail quietly. A breached silt fence or an overtopped sediment basin keeps leaking soil into the channel until someone happens to walk past it.
Why Muddy Water Is Hard to Measure From the Bank
Events are short and unpredictable. The largest sediment pulses often arrive during or just after heavy rain, at night or on weekends, when nobody is scheduled to be at the river.
Conditions are unsafe at the worst moment. Rising, fast and opaque water is exactly when a person should not be wading in to fill a bottle.
The river is not uniform. Turbidity can differ across a channel and with depth, especially below a tributary or outfall where muddy and clear water have not yet mixed.
Optical windows foul. Algae, biofilm and fine silt build up on any surface left in a river, and a coated window slowly pushes readings away from the truth.
Sites are remote and unpowered. Many reaches worth watching have no mains power, no data cable and no secure building nearby.
Inside River Turbidity Monitoring: Light, Scatter and the Path to the Platform
Turbidity is the cloudiness that suspended clay, silt, organic matter and algae give to water. A turbidity sensor does not count those particles; it measures how strongly they scatter light, a dependable stand-in for how much material the water carries.
Infrared Light Meets Suspended Particles
The CTR2 sensor head sends a beam of infrared light into the water. Infrared is far less affected than visible light by the natural tea-brown tint of dissolved organic matter. Particles in the beam redirect part of that light in every direction.
Reading the Scatter at a Right Angle
A detector placed at a right angle to the beam measures the scattered light. This side-on arrangement, known as nephelometry, is the approach described in the international standard ISO 7027 for infrared turbidity measurement. More particles mean more scattered light reaching the detector and a higher turbidity reading, reported in nephelometric units.
Temperature Correction Inside the Probe
Optical components respond slightly to temperature, and river water can warm and cool through the day and across seasons. The CTR2 uses a built-in thermistor to compensate the measurement, so a cold morning and a warm afternoon do not appear as false changes in cloudiness.
From Cloudiness to a Solids Estimate
The same optical signal can also be expressed as a concentration of suspended material in milligrams per liter, which is often the figure catchment managers and permit conditions use. The relationship between scattered light and solids depends on particle size, shape and color, so the estimate is most useful when it is checked against laboratory samples from the same river.
Placing the Sensor Head in Representative Flow
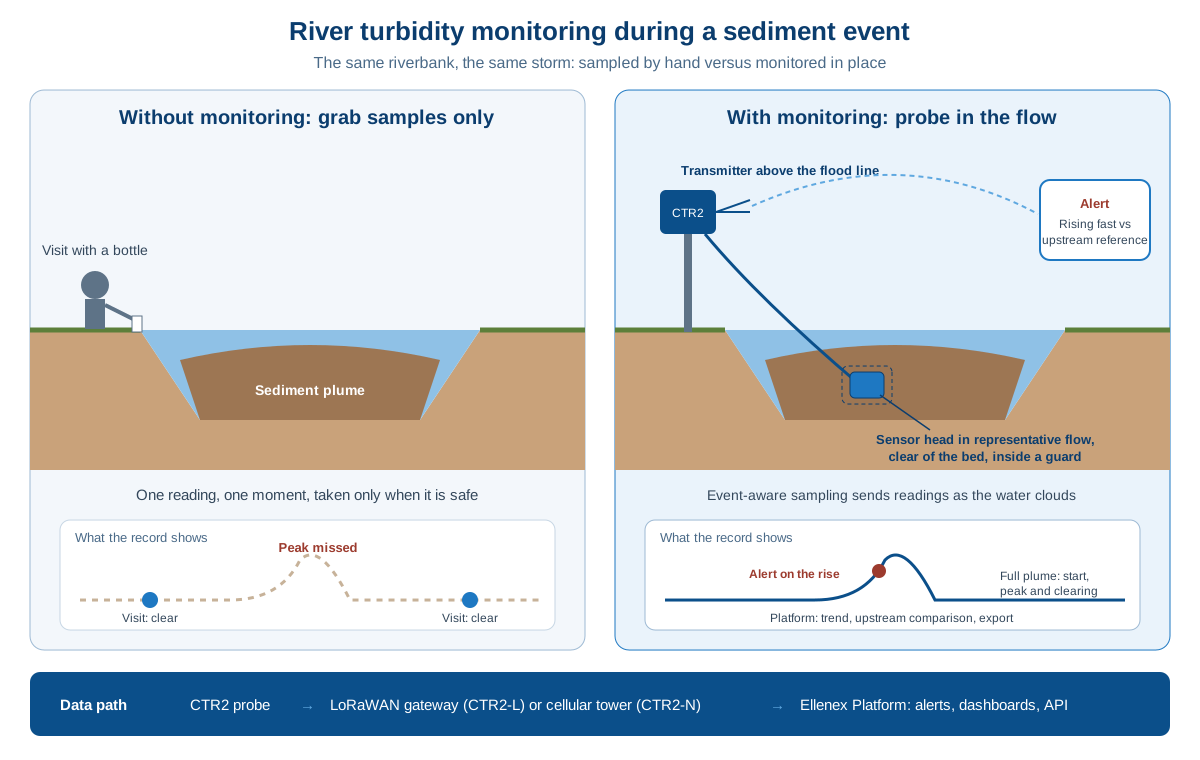
The head is fully submersible and sits on a cable below the water surface, while the transmitter is mounted above the flood line on a post, bridge rail or bank structure. Where the head sits decides what the reading represents: it needs moving water that is mixed across the channel, clear of the bed and away from eddies.
Event-Aware Sampling at the Transmitter
The transmitter takes readings on a configurable sampling interval and can send every reading, or only those that meet a condition, such as crossing a threshold. Sampling periodically through calm weather and reporting more readily when turbidity climbs keeps the battery working on the moments that matter.
Gateway Radio or Cellular Uplink
The CTR2-L sends its data over LoRaWAN to a gateway, which forwards it to the Ellenex network server for authentication and decryption. The CTR2-N skips the gateway and connects directly to a cellular tower using NB-IoT or LTE-M, chosen when the unit is ordered. Both routes carry encrypted payloads. For a fuller comparison of the two network types, see the Ellenex guide to LoRaWAN vs NB-IoT for industrial monitoring.
Platform Work: Trends, Thresholds and Upstream Comparison
On the Ellenex Platform, each reading joins a time series for that site. Users define upper and lower limits, get notified through several channels, compare upstream and downstream sites on shared dashboards, export records and pass data to other systems through the open API. The same data is available on the Ellenex mobile app for staff in the field.
Catchment Teams Who See a Plume While It Is Still Moving
Response starts with an alert, not a phone call. When the downstream probe rises sharply against the upstream reference, site and catchment staff hear about it within the next transmission, not from a complaint.
Sampling crews go out with a purpose. Laboratory samples are taken during the event, at the reach where the plume is, which makes each bottle far more informative.
Erosion controls get checked when they are under load. A rise after rain points maintenance crews to the silt fence, basin or culvert most likely to be leaking.
Background conditions are known. Months of upstream data show what the river normally carries after rain, which gives permit limits and investigations a fair baseline.
Downstream users get warning. Utilities with intakes below a monitored reach can prepare treatment changes or pause abstraction before the plume arrives.
The Business Case for Watching Sediment Continuously
These benefits are general and depend on how many sites are watched. The Ellenex guide to the financial side of IoT implementation sets out how to compare them with the effort of deployment.
Fewer Storm-Day Drives to Sampling Points
Manual event monitoring means repeated trips in poor weather. Continuous probes cover the hours between visits, so trips are made only when the data says something has changed.
Soil Kept on Site and Out of the Channel
Early warning of a failing sediment control lets a contractor repair it while the loss is still small. That protects the waterway and keeps valuable topsoil where it belongs.
Intakes, Pumps and Filters Shielded From Silt Surges
Downstream operators who know a plume is coming can adjust treatment, close an intake or switch sources before abrasive silt reaches pumps, screens and filters.
Safer Storm Response for Field Staff
Fewer people stand beside a fast, rising river to fill a bottle. Field work can wait until conditions are safe, with the data already recorded.
Erosion Maintenance Planned Ahead of the Wet Season
Patterns in the record show which sites shed sediment after moderate rain and which hold up. Maintenance budgets and crews can be directed to the weakest points before the next season.
No Trenching, No Mains, Few Parts
Battery-powered sensors with wireless links avoid cables, cabinets and power connections at the riverbank. A monitoring point can be installed, moved or removed as a project progresses.
Long Turbidity Records for Catchment Planning
Years of event data support decisions about riparian planting, stormwater upgrades and development conditions, and they give funding bids evidence rather than estimates.
CTR2 Turbidity Sensors Against Each River Challenge
The CTR2-L LoRaWAN turbidity sensor and the CTR2-N NB-IoT and LTE-M turbidity sensor share the same optical sensor head and measuring options. They differ in how they connect.
Peaks Too Large for a Single Narrow Range
River turbidity can climb from near-clear to very high within one storm. Both variants offer several fixed turbidity ranges and an automatic range that adapts to conditions, so a sensor sized for normal flow does not run off the top of its scale when the plume arrives.
Submerged Heads in Moving, Abrasive Water
Fully submersible, the sensor head is made from engineered plastics and quartz, materials chosen for long immersion in natural water. Longer cables are available on request for deep channels or high banks.
Exposed Banks and Bridge Rails
The transmitter housing is weather-sealed and UV-protected for open riverbanks. It comes in a cylindrical or rectangular form, with an internal antenna or an external antenna for sites where the signal needs help. For rivers that freeze in winter, check the operating temperature band in the datasheet before choosing a location.
Power for Long Unattended Deployments
Each CTR2 runs on a replaceable lithium battery. Its capacity is counted in readings taken and messages sent, not in time on a calendar, so the deployment life depends on how often the sensor measures and how often it sends. Reporting on change during storms and resting through dry spells is the simplest way to make the battery last. The rectangular enclosure also offers an external power option with battery backup and a high-capacity battery for demanding sites.
Threshold Alerts for Site Managers and Regulators
High and low alarm thresholds are configured on the Ellenex Platform and can be changed remotely, along with sampling and transmission settings. Alerts go out through several channels to the people assigned to each site, so a builder, a catchment officer and a utility operator can each see the readings that concern them.
Connectivity Chosen by How the Monitoring Points Are Spread
Where several probes sit within one catchment or along one development, the CTR2-L and a private LoRaWAN gateway keep data on a network the owner controls, with no per-device airtime charges. The background on this route is in what is LoRaWAN. Where probes are scattered across distant reaches, the CTR2-N connects straight to public NB-IoT or LTE-M coverage without a gateway, as explained in what is NB-IoT and LTE-M.
Mechanism and Outcome for the River and Waterway Turbidity Solution
Infrared light scattered at a right angle by suspended particles.
Outcome: A turbidity reading that is far less affected by the water's natural color.
Built-in temperature compensation.
Outcome: Daily and seasonal temperature swings do not appear as false sediment events.
Fixed or automatic measuring ranges.
Outcome: Storm peaks stay on scale and calm periods keep fine detail.
Configurable sampling and conditional transmission.
Outcome: Battery capacity is spent on events rather than quiet weather.
Two network options, a private LoRaWAN gateway or direct cellular links over NB-IoT and LTE-M.
Outcome: Coverage that fits a clustered catchment or a scattered network.
Platform thresholds, multi-channel alerts and an open API.
Outcome: The right people learn about a plume while it is still moving, and the record flows into existing systems.
Siting and Mounting Habits for River Probes
The following points reflect widely used field practice for in-stream turbidity sensors. They are general guidance, not Ellenex installation procedures, and local regulations or permit conditions take priority.
Bracket the activity. Place one probe upstream of the construction site, outfall or dredging area as a reference, and one far enough downstream that the plume has mixed across the channel.
Keep the head off the bed. A sensor resting on or near the bottom reads resuspended sediment from its own disturbance. Suspend it in the water column, clear of the bed.
Stay below the surface. Bubbles, foam and direct sunlight near the surface can affect optical readings. Set the head deep enough to stay submerged at low flow.
Use a protective guard. A perforated tube or cage lets water flow past the window while deflecting branches, leaves and floating debris during high flows.
Choose a straight, well-mixed reach. Avoid eddies, backwaters and the inside of bends, where fine sediment settles and readings lag behind the main flow.
Record the installation. Note the position, depth and mounting method so readings stay comparable after a cleaning visit or a replacement.
Spikes, Drift and Flatlines: Reading Odd Turbidity Data
A single sharp spike with no rain. Often a leaf, fish or bubble passing the window. Look at the readings either side before acting, and consider an alert rule that waits for a sustained rise.
A slow upward creep over weeks. Typically fouling on the optical window. Cleaning the window and comparing the reading before and after confirms it. The solution page lists periodic window cleaning as the main maintenance task.
Readings that stay high after the river has cleared. The head may be partly buried in deposited sediment after a flood, or a guard may be clogged. A site check after large events catches this.
A flat line at the top of the scale. The plume has exceeded the selected range. An automatic range or a wider fixed range prevents the peak from being clipped.
Gaps in the record. Check the signal path first: an external or high-gain antenna, or a different network route, can resolve weak coverage at a low-lying bank.
Operations Built on a Continuous Sediment Record
With turbidity probes in place, a sediment event becomes something a team can follow as it unfolds and review afterward. Contractors can show how their controls performed, regulators can compare downstream readings with a known background, utilities can prepare intakes before a plume arrives and catchment managers can see which reaches respond most to rain. The work shifts from chasing samples during storms to acting on a record that is already there, which is the core of the River and Waterway Turbidity Monitoring package. River turbidity data also sits well alongside other measurements, such as river and waterway pH monitoring, flood monitoring on rivers and remote rain level monitoring, which together explain why the water changed as well as when. Ellenex groups these sensors under its wider infrastructure monitoring offering.
Frequently Asked Questions
Can turbidity readings stand in for laboratory suspended solids results?
Turbidity and suspended solids are related but not identical. Turbidity measures how much light particles scatter, while a laboratory suspended solids test weighs the material filtered from a sample. The link between them varies with particle size, shape and color.
The practical approach is to collect laboratory samples during several events at the monitoring site and compare them with the sensor readings. Once that relationship is established, the continuous record can be used to estimate solids between samples, while laboratory results remain the reference for formal reporting.
How should upstream and downstream probes be compared around a construction site?
The upstream probe shows what the river is already carrying before it reaches the site. The downstream probe shows the combined effect after any runoff has entered and mixed. The difference between them, especially how it changes during and after rain, is the most useful signal of what the site contributes.
Both probes should be installed in a similar way, at similar depths and in similar flow, so differences reflect the water rather than the mounting.
Will floating debris or a passing leaf trigger a false alert?
An object passing the optical window can produce a brief spike. A protective guard reduces how often this happens, and mounting the head below the surface keeps it away from most floating material.
On the alert side, rules that respond to a sustained rise or to several consecutive high readings filter out these short spikes.
What happens to the probe when a flood buries it in sediment?
Large floods can deposit sediment around a submerged sensor and partly cover the window, so readings stay high after the river has visibly cleared.
A site visit after major events, to clear the head and guard, resolves this. A well-flowing mounting spot makes it less frequent.
How do I choose between a fixed measuring range and the automatic range?
A narrow fixed range gives fine detail at low turbidity, which suits clear streams where small changes matter. A wide range or the automatic range keeps storm peaks on scale, which suits rivers that carry heavy loads during events.
For sediment event monitoring, the automatic range is often the safer starting point because it avoids clipped peaks. If the record later shows a narrower band is enough, the range can be revisited.
Does sunlight affect an infrared turbidity reading in shallow water?
Strong direct sunlight reaching the detector can disturb optical measurements, particularly in very shallow, clear water. Infrared measurement and a detector placed at a right angle to the beam reduce, but do not eliminate, this sensitivity.
Mounting the head deep enough to stay submerged at low flow, or within a shaded guard, keeps direct light away from the window. Where readings show a daily pattern that matches sunlight rather than flow, the mounting depth is the first thing to review.
Can turbidity data show whether erosion controls on a site are working?
Yes, within limits. If the downstream probe stays close to the upstream reference during rain, the controls are probably holding. If the gap widens with each storm, or grows suddenly after one event, a control has likely been breached or overtopped.
The data points to when and roughly where the problem started, but it does not identify the exact fence or basin. It is most useful as a trigger for an inspection that confirms the cause on the ground.
Related Reading
Wireless Turbidity Sensors: Enhancing Water Quality Monitoring: the measurement theory, reporting units and calibration behind wireless turbidity sensing.
Revolutionizing Water Quality Monitoring with Advanced Turbidity Sensors: an earlier look at turbidity sensing for water quality programs.
Does Your River pH Monitoring Catch What Happens Between Samples?: continuous chemistry monitoring on the same kinds of rivers and streams.
What Are the Best IoT Sensors for Monitoring Water Quality?: an overview of pH, conductivity, turbidity and dissolved oxygen sensing.
Useful Links
Talk to Ellenex
Three details let the Ellenex team shape a turbidity plan quickly: the reach you care about, the activity upstream of it and the person who should hear first when the water turns cloudy. Share them on the Ellenex sales inquiry page; the reply will suggest a sensor variant, a network route and an alert approach for that stretch of water infrastructure monitoring.


