

Grab Samples Miss What Conductivity Monitoring in Water Treatment Catches


Key Takeaways
Measure conductivity on more than one stream. Feed, permeate and concentrate readings taken together say far more about a reverse osmosis (RO) unit than any single number.
Keep the sensor head out of the high-pressure section. Mount it in a tank, channel or low-pressure sample line, and leave the pump-to-membrane piping alone.
Trend, then alarm. A permeate value that climbs slowly over weeks is the early sign of membrane wear; set alerts only after a baseline exists.
Choose the range by stream, not by site. Permeate needs a low range, while feed and brine need progressively higher ones.
Plan reporting around the battery. The battery rating is a budget of readings and radio messages, so a sensible schedule keeps site visits rare.
A Remote RO Unit Can Look Healthy on Every Gauge but One
When did anyone last read the permeate at your most distant treatment unit, and what was it doing the week before? For many operators the honest answer is a handwritten figure from the last visit. Conductivity monitoring in water treatment replaces that figure with a continuous record of how much dissolved salt is passing through the membranes, reaching the product tank and leaving with the reject stream.
Pressure gauges and flow meters on an RO skid confirm that water is moving. They cannot confirm what the water carries. Conductivity can, because dissolved ions are what let water conduct electricity, so a rise in conductivity is a rise in dissolved solids. On an RO unit, that single property separates good membranes from tired ones and in-spec product from water that should never reach a boiler or process line.
Ellenex supports this work with its Salinity and Conductivity Monitoring solution for unattended treatment skids, built around battery-powered CSD2 sensors that report to the Ellenex Platform over LoRaWAN or cellular networks. This article stays with process control: RO performance, total dissolved solids (TDS) limits and the quality of treated water. Salinity in rivers and estuaries is a separate subject.
For a broader look at the sensor family, the earlier conductivity and salinity overview covers the environmental side. Here the focus is narrower and more operational.
When Salt Slips Through Unnoticed
Membrane damage that compounds. Oxidant exposure, chemical attack or abrasion opens the membrane surface. Salt passage rises gradually, and by the time someone notices a taste or a scaling problem downstream, replacement is the only fix.
Off-spec water sent to sensitive users. Boiler feed, cooling make-up, rinse water and blending lines all depend on low dissolved solids. Water that drifts out of specification can leave scale, corrosion or rejected batches behind.
Seal and connector leaks hiding in the vessel. A failed O-ring or interconnector lets feed water bypass the membrane. Permeate quality steps up suddenly, but only a reading taken that day will show the step.
Cleaning carried out too late. Scaling and fouling that are caught early respond to routine cleaning. Left alone, they become harder to remove and shorten membrane life.
Reject streams that breach discharge conditions. Concentrate carries the salt the membranes removed. Without a record of its strength, a site has little evidence to show that disposal stayed within its permit.
Why Dissolved Salts Are Tricky to Track at Remote Units
Nobody is standing at the skid. Many units run at mine camps, pump stations, farms and industrial outstations, and they are visited on a schedule set by travel time, not by water quality.
Handheld meters sample a moment. A spot check catches the unit in one condition and misses overnight starts, feed changes and cleaning cycles.
Temperature moves every reading. Conductivity rises as water warms, so an uncorrected value can suggest a membrane problem that is really a seasonal change in feed temperature.
Very pure water is easy to disturb. Low-conductivity permeate picks up carbon dioxide from the air and residue from sample bottles, which makes grab samples less trustworthy than an in-place sensor.
Each stream needs its own range. Feed, permeate and concentrate differ widely in strength, and one instrument range rarely suits all three.
Power and data links are scarce. Small skids often lack a control system with spare inputs, and running cable to a remote compound costs more than the instrument.
Conductivity Monitoring in Water Treatment, Followed Across One RO Unit
Four Electrodes and an Alternating Current
The CSD2 measures conductivity with a four-electrode cell driven by alternating current, as described in the solution datasheet. In general terms, a four-electrode design uses one pair of electrodes to pass current and a second pair to sense voltage. Keeping those jobs separate reduces the influence of electrode polarization and of thin coatings on the electrode surfaces, which matters in water that is not perfectly clean.
Correcting Every Value for Water Temperature
Each CSD2 includes a thermistor for temperature compensation. The transmitter reports conductivity referenced to a standard temperature, so a warm afternoon and a cool morning can be compared fairly. Water temperature is also reported alongside the reading, which helps when a trend needs explaining.
Choosing the Streams Worth Measuring
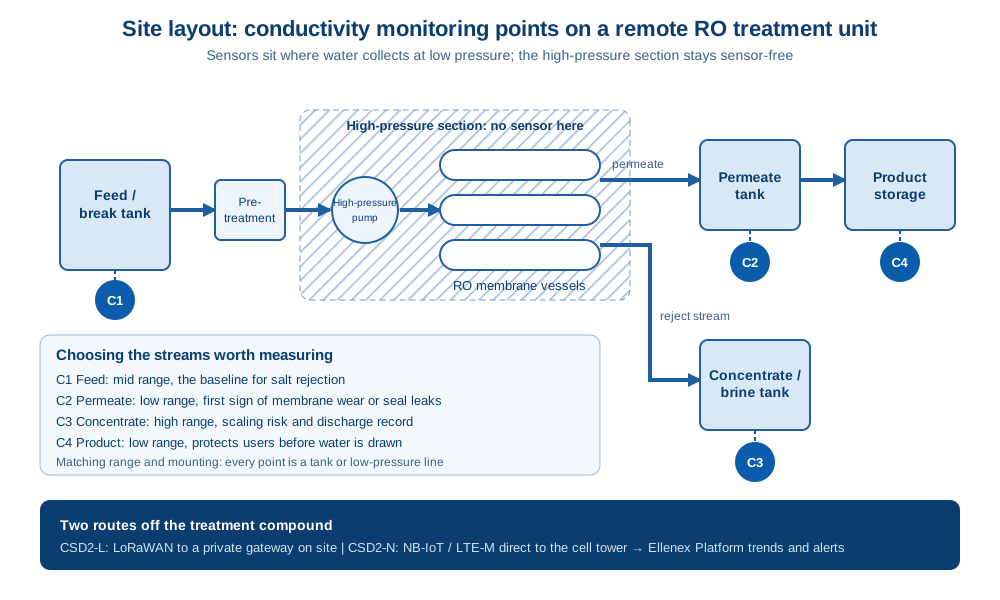
On a typical RO unit, the useful points sit where water collects at low pressure: the feed or break tank before pretreatment, the permeate tank, the concentrate or brine tank, and the product storage that serves users. Comparing feed and permeate readings shows how well the membranes are rejecting salt. The concentrate reading shows how hard the reject end is working, which is where scaling usually begins.
Matching Range and Mounting to Each Stream
The CSD2 is offered in four conductivity ranges, from a low range suited to permeate through to a high range for brine and seawater. The submersible sensor head is made of PVC, Delrin and stainless steel, yet it is rated for low-pressure service. That makes tanks, open channels and low-pressure sample lines the right homes for it, and the high-pressure piping between pump and membranes the wrong one.
What the Transmitter Reports Besides Conductivity
Alongside conductivity, the transmitter reports salinity, a TDS value referenced to potassium chloride and water temperature. A TDS figure derived this way is an estimate based on a reference salt, so it is best read as a trend indicator and checked against laboratory results when a regulatory figure is needed.
Sampling Plans That Respect the Battery
Readings are periodic by default, and they can also be triggered by events. The interval is configurable remotely, and the LoRaWAN version can transmit with every sample, on events or only when set conditions are met. That flexibility allows a calm schedule in steady operation and closer attention during start-up or after cleaning.
Two Routes Off the Treatment Compound
The CSD2-L sends readings by LoRaWAN to an Ellenex industrial outdoor gateway, which relays them through the network server to the Platform. The CSD2-N talks to a public cell tower itself over NB-IoT or LTE-M, so no gateway is needed. The DO control post walks through the same two routes for an aeration basin, so they get only a brief recap here.
Turning Readings Into Membrane Trends on the Platform
Inside the Ellenex Software Platform, readings become dashboards, historical charts and high and low alarm thresholds with alerts sent over several channels. Data can be exported, passed to other systems through integration APIs and webhooks, or connected to SCADA, so permeate quality can sit beside flow and pressure in a single control room view.
Water Quality Decisions Made From the Office
Permeate drift seen in days, not at the next visit. A slow rise appears on a chart while the membranes still have life left.
Every stream compared on one screen. Feed, permeate and concentrate trends line up, so a change in source water is easy to separate from a membrane fault.
Product tanks protected before users draw from them. An alert on rising product conductivity gives time to divert or hold water.
Cleaning booked on evidence. Rising concentrate strength and falling rejection point to the right moment for a clean.
Discharge records built automatically. A continuous concentrate record supports reporting without extra sampling trips.
One view for a scattered fleet of units. Operators responsible for many sites see which unit needs attention first, inside the same water infrastructure monitoring view they use for tanks, pipes and pumps.
What Continuous Salt Readings Return on a Treatment Budget
The financial case for IoT implementation sets out how to weigh these returns for a specific project. In general terms, the value shows up in seven places.
Long Drives Swapped for a Dashboard Check
Routine trips to read a handheld meter fall away. Visits happen when the data says a unit needs hands-on work, which matters most where a site is hours from the depot.
Treated Water Kept Fit for Its Purpose
When permeate drifts, operators can respond before a full product tank is spoiled. That protects water that has already cost energy and chemicals to produce.
Membranes Replaced Later, Not Sooner
Early warning of fouling and scaling lets routine cleaning do its job. Membranes that are cleaned at the right time tend to last longer than membranes cleaned in a rush.
Fewer Hands in Chemicals and Confined Corners
Sampling at remote compounds can mean ladders, tank hatches and nearby cleaning chemicals. Fewer routine sampling trips mean fewer of those exposures.
Cleaning, Chemicals and Spares Ordered Ahead
A trend that shows how fast performance is falling gives maintenance planners time to schedule a cleaning crew, stock chemicals and order replacement elements.
Quick to Fit, With No Trenching
Battery power and wireless reporting avoid cable runs, conduit and control system changes. A sensor can be installed on a unit that is already running.
Evidence Behind Upgrade and Pretreatment Choices
Months of conductivity data show whether a source water is changing, whether pretreatment is coping and whether a larger unit or a different membrane is worth the spend.
How Conductivity Sensors Meet the Problems of Remote RO Units
No One on Site: Unattended Reporting
The CSD2-L LoRaWAN conductivity sensor and the CSD2-N cellular conductivity sensor arrive preconfigured, with no programming or hardware settings needed. Once mounted, they report on their own schedule and need no local software.
Spot Checks Replaced by Continuous Records
Instead of one reading per visit, the Platform holds a record of every sample. That makes start-ups, feed changes and cleaning cycles visible after the fact.
Temperature Swings Handled Inside the Sensor
Built-in thermistor compensation means the reported conductivity reflects dissolved salt rather than the season. Both variants carry the same compensation, so readings from mixed fleets compare cleanly.
Low, Medium and High Streams Each Get a Matching Range
Four ranges cover streams from permeate to brine. A site would typically choose a low range for the permeate tank and a higher one for feed and concentrate, using a separate sensor for each.
Outdoor Compounds and Wet Plant Rooms
The sensor head can stay fully submerged, while the transmitter is housed in a weather-sealed enclosure with UV protection. A cylindrical or rectangular enclosure can be chosen, with an internal or external antenna and a high-gain antenna on request for weak signal locations.
A Battery Budget Counted in Readings and Transmissions
Each CSD2 runs on a replaceable lithium battery whose rating is a total of readings and transmissions rather than a calendar figure. How long it lasts in service depends on the schedule you set, and the cellular version carries a lower transmission rating than the LoRaWAN version. Where mains power is close, the rectangular enclosure can be ordered with an external power connector and battery backup, or with a high-capacity battery.
Clustered Units on LoRaWAN, Scattered Units on Cellular
Where several treatment units share a compound or a plant, one private gateway can serve all of them through the CSD2-L, with no airtime charges for each sensor. Where units are spread across a region, the CSD2-N connects to NB-IoT or LTE-M coverage directly, and it supports UDP, LwM2M, MQTT and NIDD for teams that route data their own way. The Ellenex knowledge center explains LoRaWAN and NB-IoT and LTE-M in more depth.
The Ellenex Conductivity Package: Mechanism and Outcome
A four-electrode cell with temperature compensation measures conductivity in a low-pressure stream.
Outcome: Readings track dissolved salt rather than temperature or electrode coatings.
Range-matched sensors sit in the feed, permeate and concentrate tanks. Outcome: Salt rejection, product quality and reject strength are visible together.
Configurable sampling and conditional transmission.
Outcome: Close attention during start-up and cleaning without draining the battery in steady running.
Two radio options: LoRaWAN through an on-site gateway, or a cellular link from each sensor to the nearest tower.
Outcome: Data reaches the Platform from clustered plants and isolated outstations alike.
Platform alarms, encrypted data, APIs and SCADA links.
Outcome: Off-spec water triggers action, and records feed the systems that already run the plant.
The complete package, including the gateway and Platform license options, is set out on the conductivity monitoring solution page. Related Ellenex solutions cover the other measurements an RO operator usually wants: pH monitoring in remote water treatment units, turbidity monitoring in remote water treatment units and differential pressure across filters and membranes.
RO Vocabulary for Non-Specialists
Permeate: The treated water that has passed through the membrane. Its conductivity is the main measure of product quality.
Concentrate (reject or brine): The stream that carries away the salts the membrane held back.
Salt rejection: The share of dissolved salt the membranes keep out of the permeate, judged by comparing feed and permeate conductivity.
Salt passage: The opposite view of the same comparison; a rising salt passage means the membranes are letting more through.
Recovery: How much of the feed water ends up as permeate. Higher recovery concentrates the reject stream and raises scaling risk.
Normalization: Adjusting performance data for changes in temperature, pressure and recovery so that real membrane changes stand out.
TDS (total dissolved solids): The mass of dissolved material in water, commonly estimated from conductivity using a reference salt.
Standards That Shape RO Water Quality Records
Two references are worth knowing when setting up a record. ASTM D4516, the Standard Practice for Standardizing Reverse Osmosis Performance Data published by ASTM International, describes how to normalize RO performance so that membrane changes can be separated from changes in operating conditions. Continuous feed and permeate conductivity, logged with temperature, is exactly the kind of data that practice relies on.
For drinking water, the US Environmental Protection Agency lists total dissolved solids among its National Secondary Drinking Water Regulations, which are non-enforceable guidelines covering taste, odor and appearance. Industrial users usually work to tighter internal specifications for boiler feed or process water, and concentrate disposal is governed by the site's own discharge permit. Ellenex sensors provide the data for these records; they do not certify compliance on their own, and laboratory confirmation remains the reference where a permit requires it.
Treatment Units That Report Their Own Water Quality
With conductivity reported from the feed, permeate and concentrate of each unit, operations teams stop depending on the timing of a site visit to learn how their membranes are performing. Drift is seen while it is still small, product water is protected before it reaches users, cleaning happens when the trend calls for it and discharge records accumulate without extra work. Across a portfolio of remote units, that adds up to fewer surprises, longer membrane life and a clear picture of which site needs attention first, all within the wider infrastructure monitoring approach Ellenex applies to remote assets.
Frequently Asked Questions
What does conductivity tell you about water quality in a treatment plant?
Conductivity measures how easily water carries an electric current, and in practice that depends on how many dissolved ions it holds. Pure water conducts very poorly, while water carrying dissolved salts, minerals or process chemicals conducts much more readily. That makes conductivity one of the quickest and most practical indicators of dissolved solids in a treatment system. Operators use it to judge how well a reverse osmosis or ion exchange stage is removing salts, whether product water still meets the specification its users rely on, and how concentrated the reject stream has become before disposal. Because it responds within seconds and needs no reagents, it is far better suited to continuous oversight than chemical tests that have to be run in a laboratory.
The Ellenex Salinity and Conductivity Monitoring solution puts that indicator into a battery-powered sensor designed for unattended treatment units. Each CSD2 sensor uses a four-electrode cell driven by alternating current and reports conductivity together with salinity, an estimated TDS value and water temperature. Readings travel to the Ellenex Platform, where feed, permeate and concentrate trends can be compared on one screen. Instead of a single figure written down at the last site visit, operators get a running record that shows how the water is changing, which is the information they actually need to keep a remote unit producing water fit for its purpose.
What is the difference between conductivity, TDS and salinity?
The three terms are related but not interchangeable. Conductivity is the property that is actually measured: the ability of water to conduct electricity, which rises as more ions are dissolved in it. Total dissolved solids, or TDS, is the mass of material dissolved in the water, and salinity describes the salt content, a term used mostly for brackish water, seawater and brines. A laboratory finds TDS by evaporating a sample and weighing what is left, but online instruments estimate both TDS and salinity from conductivity using a conversion based on a reference salt. That estimate works well for trending, yet the true relationship depends on which ions are present, so a water rich in one salt can read slightly differently from another with the same dissolved mass.
Ellenex CSD2 sensors report all three values from a single measurement: conductivity, salinity and a TDS figure referenced to potassium chloride, along with water temperature. For day-to-day operation, that gives operators whichever unit their procedures or customers use without needing extra instruments. Where a regulator or permit requires a formal TDS result, the sensible approach is to treat the online value as a continuous trend and confirm it periodically against laboratory analysis. The CSD2-L and CSD2-N product pages list the measurement options for each variant.
How does water temperature affect conductivity readings?
Ions move more freely in warm water than in cold water, so the same water will show a higher conductivity on a hot afternoon than on a cool morning even though nothing about its dissolved content has changed. On outdoor treatment units, where feed water temperature can swing between seasons and even between day and night, an uncorrected reading can easily suggest that membranes are deteriorating or that product water is drifting when the real cause is the weather. For that reason the industry convention is to report conductivity referenced to a standard temperature, so that values taken at different times and in different places can be compared fairly.
Every Ellenex CSD2 sensor includes a thermistor that measures water temperature at the sensing head and applies compensation before the reading is sent. The transmitter also reports the measured temperature alongside conductivity, which helps an engineer explain a change in the trend or normalize membrane performance data. Both the LoRaWAN and the cellular versions carry the same compensation, so a fleet that mixes the two can be compared directly on the Ellenex Platform. The result is a record that reflects what is dissolved in the water rather than what the thermometer happened to say at the time of sampling.
Can continuous conductivity monitoring extend membrane life and reduce cleaning costs?
Membrane problems usually develop gradually. Fouling, scaling and chemical damage each show up as a slow change in how much salt passes into the permeate or how concentrated the reject stream becomes, long before a membrane fails outright. When those changes are caught early, routine cleaning is generally effective and the membranes return to good performance. When they are discovered late, deposits are harder to remove, cleaning has to be more aggressive and replacement often becomes the only option. Continuous conductivity data turns that slow drift into a visible trend, so cleaning can be scheduled at the right moment instead of on a fixed calendar or after a complaint.
With Ellenex sensors on the feed, permeate and concentrate streams, the Ellenex Platform shows salt rejection and reject strength over weeks and months. Configurable high and low thresholds raise alerts across several channels when a value moves outside its normal band, and historical charts give maintenance planners the evidence to book a cleaning crew, order chemicals and spare elements ahead of time. Because each sensor range is matched to its stream, from a low range for permeate to higher ranges for feed and brine, the readings stay meaningful across the whole unit. Related Ellenex solutions for membrane differential pressure add a second view of fouling for operators who want both.
Why monitor conductivity remotely instead of relying on handheld meter checks?
Handheld meters are useful tools, but they only capture the moment someone happens to be standing at the unit. Remote treatment skids at mine camps, farms, pump stations and industrial outstations are often visited on a schedule set by travel time, so a reading may be days or weeks old by the time anyone looks at it. Spot checks also miss start-ups, cleaning cycles, overnight changes and sudden steps caused by a failed seal. Very pure permeate is easily disturbed by air and sample containers as well, so a grab sample can mislead even when it is taken carefully. Continuous measurement in place removes those gaps and gives every change a time stamp.
Ellenex sensors arrive preconfigured and need no local software or control system inputs, which suits small skids that have no spare wiring. The CSD2-L reports over LoRaWAN through a private industrial gateway, a good fit where several units share one compound, while the CSD2-N connects directly to NB-IoT or LTE-M towers for units spread across a region. Both run on a replaceable lithium battery whose rating is set by readings and transmissions, so the reporting schedule decides how long it lasts in service. Data on the Ellenex Platform can be exported or shared through APIs, webhooks and SCADA links, putting water quality alongside the rest of the plant's operational data.
Related Reading
The Critical Role of Conductivity and Salinity Monitoring in Modern Water Infrastructure: an overview of the CSD2 family with an environmental focus.
Is Dissolved Oxygen Control in Aeration Wasting Your Blower Energy?: how optical oxygen readings guide aeration in remote treatment basins.
IoT-Enabled Sensors in Industrial and Treatment Plants: a wider look at water quality data across treatment processes.
What Are the Best IoT Sensors for Monitoring Water Quality?: parameters and sensor types compared for water quality work.
Useful Links
Talk to Ellenex
Your last permeate reading is the place to begin. Note the figure, which streams you can reach at low pressure and how far each unit sits from the nearest gateway or cell tower, then send those details through the Ellenex sales inquiry page. The team will suggest ranges, a connectivity route and a reporting schedule suited to your units and to your wider water infrastructure monitoring program.


