Is Dissolved Oxygen Control in Aeration Wasting Your Blower Energy?


Key Takeaways
Match the air to the load, not the clock. A basin's oxygen demand swings through the day, so a fixed blower schedule is over-serving it at some hours and starving it at others.
Read oxygen where the biology lives. A submersible optical probe in the mixed liquor records what the microorganisms actually experience, which no inlet flow figure can tell you.
Let a target band do the watching. High and low thresholds on the platform turn a quiet basin into an alert only when oxygen leaves the range you chose.
Treat sampling as a spending decision. Battery capacity is counted in readings and transmissions, so the reporting cadence decides how long a unit can stay unattended.
Pick the route by site layout. LoRaWAN through a private gateway suits basins clustered on one works, while NB-IoT/LTE-M suits units scattered across a region.
Ellenex builds this around the CDO2 pair of battery-powered optical dissolved oxygen sensors, described on the Dissolved Oxygen Monitoring in Remote Industrial Water Treatment Units solution page. Both variants report to the Ellenex Platform without a cable run to the control room.
Blowers Run on a Timer; Biology Runs on Demand
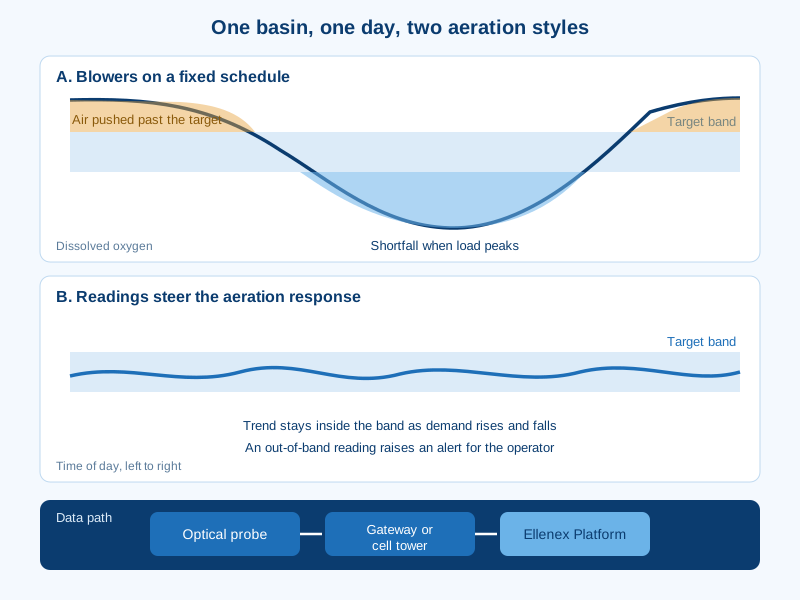
Dissolved oxygen control in aeration means giving a biological treatment basin the air its microorganisms need, and no more. Most remote basins are not managed that way. A blower is set to a schedule or a fixed speed, someone notes the setting on a clipboard, and the basin copes with whatever the inflow brings.
Biology does not follow the clipboard. Load climbs with morning flows, trade discharges and storm inflow, then falls away overnight. When the air supply ignores that rhythm, the basin spends part of every day over-served and part of it short of oxygen, and nobody sees either until the effluent report or the power bill says so.
A continuous oxygen reading changes that conversation. It shows real demand hour by hour, so aeration can be tightened or relaxed on evidence rather than habit. Ellenex supports this with optical probes built for treatment units far from the control room, and the CDO2-L and CDO2-N variants cover both private-gateway and cellular sites.
This article follows one oxygen measurement from the probe to the dashboard, explains what it means for energy and process stability, and places it within wider water infrastructure monitoring. Oxygen in rivers and streams is a different problem with different goals, so the focus here stays inside the treatment unit.
Air Wasted and Air Withheld: What Blind Aeration Costs
A basin can be wrong in two directions, and both directions cost money. These are the failures operators describe most often when aeration runs without feedback.
Electricity spent on air nobody needed. Aeration can be among the largest power loads at a treatment works, so blowers running hard through quiet hours turn directly into waste.
Oxygen shortfalls at peak load. When supply lags demand, the organisms that break down the waste slow down, and effluent quality slips with them.
Sludge that settles badly. Poorly matched oxygen conditions can favor filamentous growth and bulking, which pushes solids into the stages downstream.
Odor complaints from starved zones. Corners of a basin that run short of oxygen can turn septic, and neighbors tend to notice before operators do.
Compliance gaps explained too late. A grab sample captures one moment, so a bad batch of results arrives without any record of what the basin was doing beforehand.
Why Aeration Basins Hide Their Oxygen Story
Oxygen is one of the fastest-moving numbers in a treatment plant, and basins make it hard to follow. These are the obstacles that keep operators working from assumptions.
Oxygen moves faster than visits. Demand changes within hours, while handheld checks happen daily or weekly at best.
A basin is not one uniform volume. Readings differ between zones near the diffusers and zones far from them, so a single spot check can mislead.
Remote units are costly to reach. Package plants, lagoons and industrial treatment units often sit far from the main site, with long drives for a quick reading.
Mixed liquor fouls whatever sits in it. Grease, biological film and solids coat instruments left in the water.
Conventional probes demand upkeep. Older electrochemical designs rely on consumable parts and regular servicing, which is hard to sustain across scattered sites.
There is rarely power or wiring at the basin edge. Trenching cable to a distant basin can cost more than the instrument itself.
Dissolved Oxygen Control in Aeration: Following One Measurement Around the Loop
The path from water to decision has six stages. Each one answers a specific question: what is measured, how it is corrected, where it is taken, what is sent, how it travels, and what happens on arrival.
Light, Luminescence and a Fading Glow
The CDO2 probes use luminescence-based optical sensing. A sensing surface is lit, glows briefly, and the glow dies away faster when oxygen is present. The electronics read the timing of that fade, using phase-shift detection, and convert it into an oxygen value.
Because the method relies on light rather than a reaction that consumes the sensing element, it avoids the electrolyte routine of older probes. The datasheets also state that the water does not need to be moved across the sensor, which makes placement easier in quiet zones.
Temperature Rides Along With Every Oxygen Reading
Warm water holds less oxygen than cool water, and the optical response itself shifts with temperature. The probe therefore measures water temperature as well and compensates inside the sensor. Both values reach the platform, which helps explain why a basin needs different air in summer than in winter.
Choosing a Position That Represents the Basin
This stage is general practice, not an Ellenex procedure. Place the sensor head at working depth, away from the immediate plume of a diffuser and clear of walls and corners. Pick a spot that stays submerged as levels change, and fix the cable so it cannot swing into moving equipment.
A Transmitter That Decides What Is Worth Sending
Factory calibration is applied on the device, so the transmitter digitizes and corrects the reading before anything leaves the basin. Payloads are encrypted, and low-power sleep modes keep the electronics idle between samples.
Sampling and transmission are separate settings. A unit can sample steadily and transmit only when a reading crosses a threshold, or send every sample when the plant wants a full record. That choice belongs to the operator and can be changed from the platform.
Reaching the Platform by Gateway or by Tower
On the LoRaWAN route, the CDO2-L sends its packets to an outdoor gateway, which bridges the radio link to the internet. The Ellenex network server then authenticates the device, decrypts the payload and removes duplicate frames before passing data to the platform. What is LoRaWAN explains the technology in more detail.
On the cellular route, the CDO2-N talks directly to a public cell tower over NB-IoT or LTE-M, and no gateway is needed. The unit ships with a SIM and an active subscription for the transmitter. For the underlying technology, see what NB-IoT and LTE-M are.
What the Platform Does With Each Reading
The Ellenex Platform decodes each message and plots oxygen and temperature on a dashboard that works on the web and on mobile. It supports high and low thresholds, sudden-drop detection, anomaly alerts and several notification channels, along with device health and trend views. The Ellenex Platform page lists the full feature set, and ellenex.net is where operators log in.
Treatment Works That Report Their Own Oxygen
Once every basin streams its readings, the daily pattern of work changes in practical ways. The same approach extends across the wider water infrastructure monitoring estate, from tanks and bores to treatment units.
Aeration is judged by the curve, not the clipboard. A day of readings shows when demand starts to climb and when it eases, which a once-daily number cannot.
Alerts replace routine rounds. Staff go to a basin when its oxygen leaves the band, rather than on a fixed walk that finds nothing most days.
Night and day get separate treatment. Overnight readings show how much air a quiet basin truly needs.
Seasonal drift becomes visible. Temperature and oxygen logged together reveal how summer and winter change the demand.
One dashboard covers scattered units. Remote package plants and industrial basins sit beside the main works on the same screen.
Evidence is on file. Logged readings support conversations with regulators, auditors and the board.
What Tighter Oxygen Control Is Worth Across a Treatment Train
Every benefit below is described in general terms, because the size of each one depends on the plant. The financial case for IoT implementation page sets out how to frame the numbers for your own site.
Blower Energy Matched to Real Demand
When aeration follows measured oxygen, blowers stop pushing air that the biology cannot use. The saving appears on the power bill, and it scales with how much of the day a basin spent over-served before.
Handheld Probe Rounds Cut Back
A remote basin no longer needs a visit just to read a number. Vehicles stay parked and staff time goes to repairs, sampling for lab work and process tuning.
Biology That Stays Settled
Steady oxygen supports steady treatment. A basin kept inside its target band is less likely to swing between starved and over-aerated states, so the community of microorganisms stays stable and effluent quality holds up.
Blowers Spared Needless Hours
Equipment that runs only as hard as demand requires wears more slowly. Fewer hours at full duty mean longer intervals between servicing.
Fewer Trips to Wet, Slippery Edges
Leaning over an open basin to lower a handheld probe carries real risk. Continuous readings reduce how often anyone has to do it.
Low Cost to Put in Place
The probes are battery powered and ship pre-configured, and the datasheet describes a deployment that needs no special tools or drivers. There is no trench, no mains supply and no panel to build at the basin edge.
Data for Upgrade Decisions
A year of oxygen and temperature history shows whether an existing blower is oversized, whether a basin needs more diffusers, and where an upgrade would earn its keep.
CDO2-L and CDO2-N Against Real Aeration Demands
Each challenge from the earlier sections has a matching feature in the CDO2-L and CDO2-N sensors. This section sets them side by side.
A Submersible Head Made for Mixed Liquor
The sensor head is fully submersible and built from corrosion-resistant stainless steel, with titanium available on request. It tolerates the constant wet, chemically active conditions of a treatment basin, and the optical method keeps it free of consumable electrolyte.
Weather-Sealed, UV-Protected Housings
The transmitter sits in a weather-sealed, UV-protected enclosure that is available in cylindrical or rectangular forms, with internal or external antenna options depending on the variant. Choose the form that suits the mounting point at your basin.
Battery Planning Around Reading Cadence
The built-in lithium battery is rated in readings and in transmissions, and the two are not the same number. How long a unit lasts in the field depends on how often it samples and how often it sends, so pick a cadence that matches how fast your basin changes. External power is available as an option on certain models.
Setpoint Alerts Editable From the Platform
Thresholds, sampling intervals and transmission conditions are set on the platform and pushed to the device, so retuning an alert does not need a trip to the basin. An operator can start with a wide band and tighten it as confidence grows.
Cable Length and Enclosure Chosen to Fit the Basin
A standard cable length ships with the sensor, and longer or shorter cables are available on request. Reach from bank to working depth is worth measuring before ordering.
Gateway Cluster or Cellular Tower, Chosen by Layout
Where several basins sit on one works, the LoRaWAN CDO2-L reports through one private gateway and avoids carrier fees on that network. Where units are scattered across a region, the CDO2-N reaches the nearest tower directly. Both feed the same platform, so a mixed estate still appears on one dashboard.
The Ellenex Oxygen Package, Cause to Effect
Mechanism: a submersible optical probe measures oxygen and temperature in the basin, corrects them in the transmitter and sends encrypted readings by gateway or cellular tower. Outcome: operators see real oxygen demand without a site visit.
Mechanism: high and low thresholds, sudden-drop detection and multi-channel notifications run on the platform. Outcome: the right person hears about a problem while it is still small.
Mechanism: battery power, pre-configuration and quick deployment remove cabling and commissioning work. Outcome: remote basins join the network without a large project.
Mechanism: open API, webhooks and SCADA integration pass data on to the systems a plant already runs. Outcome: oxygen history informs aeration decisions and reporting alongside everything else.
Keeping the Optical Window Honest Between Site Visits
The datasheets describe the sensor as factory calibrated and not needing recalibration, and they do not set out a cleaning procedure. The advice below is general practice, so confirm any method with Ellenex before relying on it.
Biological film and grease can build on a sensing surface and slow the response. Plan periodic visual checks at intervals that match how fouled your basin gets, and shorten them if readings begin to flatten or lag behind the process.
Occasionally compare the probe against a trusted handheld reference taken beside it. Write down the date, the position and the difference, so a slow drift shows up in your records before it shows up in a decision.
Letting Oxygen Data Reach the Systems That Run the Blowers
The platform offers an open API, webhooks, data forwarding and connections to enterprise, SCADA and ERP systems. That means oxygen readings can be pushed into the control or reporting tools a plant already uses, while decisions about blower logic stay with the plant's own engineers.
Export and import tools support periodic reports. Role-based access lets contractors see the units they service without seeing the whole estate, and white-label options exist for enterprise use.
An Aeration Basin That Reports Its Own Oxygen Demand
A basin that streams oxygen and temperature gives its operators the one thing aeration has always lacked, which is feedback. Blowers can be steered by evidence, alerts reach people only when they matter, and the history sits ready for the next upgrade or audit. The Ellenex solution page gathers the products, the connectivity options and the platform in one place.
Frequently Asked Questions
Where in an aeration basin should the probe go?
Choose a position that represents the mixed liquor, away from the strongest diffuser plume and clear of walls and corners. This is general practice, and a site survey with a handheld probe can help you compare several spots before you commit.
Keep the sensor at a depth that stays submerged as levels change, and make sure the cable route does not tangle with moving equipment.
Does one probe describe the whole basin?
One probe describes the spot it sits in. In a well-mixed basin that can be a fair stand-in for the whole volume, but a long or zoned basin can behave differently from end to end.
If zones matter to your process, place a probe in each and compare the trends on the platform.
Why does the reading dip right after a blower stops?
Oxygen is consumed continuously by the biology, so when air input drops, the reading falls at a rate set by the load. The shape of that fall is useful information about how much demand the basin carries.
Logged alongside blower events, the curve helps you decide whether the blower can safely rest longer or needs to stay on.
Can alerts warn about too much air as well as too little?
Yes. High and low thresholds are separate settings, so you can alert on a basin that drifts above its band as well as one that sinks below it.
A high-side alert is how a plant finds out that blowers are working harder than the process needs.
How should I set the target band at first?
Start with a band wide enough to avoid constant alerts, then watch a few weeks of readings before narrowing it. Your process engineer or treatment consultant knows the biology better than any default.
The platform lets you adjust thresholds remotely, so tightening the band later costs no site visit.
Will foam or heavy solids upset an optical sensor?
Heavy biological film on the sensing surface can slow the response, which is why periodic inspection matters. Position also helps, because a spot with steady circulation tends to foul less than a stagnant corner.
If readings flatten or lag behind the process, check the sensing surface first, and confirm any cleaning method with Ellenex.
Can the readings feed the SCADA that already controls my blowers?
The platform offers an open API, webhooks and SCADA connections, so readings can flow into the systems you already run. What those systems do with the data remains your plant's decision.
Talk to Ellenex about the integration route your control system supports before you plan the project.
Related Reading
Dissolved Oxygen Sensor: IoT's Role in Environmental Monitoring: a broader look at optical versus electrochemical sensing and the wider uses of oxygen data.
Bytes for Better Water Quality Management: how IoT sensors support industrial and treatment plants across several water quality measurements.
What are the best IoT sensors for monitoring water quality?: a guide to the sensing principles behind pH, conductivity, turbidity and oxygen probes.
Conductivity and Salinity Monitoring in Modern Water Infrastructure: a technical analysis of another measurement that matters in treatment and cooling systems.
Useful Links
Talk to Ellenex
Start with a single sentence about how the blowers at your basin are driven today, then add where the basin sits in relation to power and mobile coverage. Send both through the Ellenex sales inquiry page, and the team will reply with a probe, a connectivity route and a first alert setup. For more on infrastructure monitoring as a whole, see the Ellenex Infrastructure Monitoring overview.