

Duct by Duct: How HVAC Airflow Monitoring Replaces Guesswork


Key Takeaways
Measure the air, not the room: HVAC airflow monitoring reads what each duct actually delivers, so a warm conference room can be traced to a starved branch instead of being blamed on the thermostat.
Differential pressure is the signal: a pair of pressure taps in the duct stream gives velocity, and with the duct's cross-section known, volumetric flow follows.
Pick the route per building: LoRaWAN with a private gateway suits a campus of plant rooms, while NB-IoT/LTE-M suits a portfolio of scattered buildings.
Let the report schedule drive the battery: sampling and transmission intervals are configurable, so reading frequency should match how fast the duct really changes.
Start with the ducts people complain about: a handful of well-placed transmitters on trunks, far branches and return paths usually tells more than a single reading at the air handler.
Thermostats Report Temperature, Not Air Delivery
A thermostat reports how warm a room is. It says nothing about how much conditioned air arrived to make it that way. Between the air handling unit and the diffuser sit trunk ducts, dampers, branches and filters, and any one of them can quietly change what a room receives.
HVAC airflow monitoring closes that gap by measuring the moving air inside the duct itself. Instead of inferring delivery from comfort complaints or a technician's annual balancing visit, a building team gets a continuous record of how each duct behaves through the day and across the seasons.
Ellenex builds battery-powered transmitters for exactly this job, described on the airflow monitoring in HVAC systems solution page. They sense differential pressure, convert it into airflow values and report over LoRaWAN or cellular LPWAN, with no new cabling to the plant room.
This article walks through what goes wrong when ducts are left unmeasured, how the sensing works, where the return comes from and how to choose a configuration. It is general guidance for facilities managers and building engineers, and every Ellenex capability mentioned comes from the product and solution datasheets.
Starved Rooms, Overworked Fans and Hidden Breaches
Unmeasured airflow fails quietly. The costs below are general patterns rather than any single site, but most facilities teams will recognize them.
Uneven comfort that gets blamed on the wrong thing: a far branch receiving less air than designed produces hot or stuffy rooms, and the first response is often a thermostat adjustment that cannot fix a delivery problem.
Fans working harder than the building needs: when filters load up or dampers drift, fans compensate with more effort, and the extra energy shows up on utility bills long before anyone traces it to a duct.
Breaches that go unnoticed: a disconnected joint, a collapsed flexible duct or a stuck damper can divert air into ceiling voids for weeks, leaving occupied zones short while the plant appears to run normally.
Ventilation shortfalls that nobody logs: low outdoor air delivery affects indoor air quality in ways occupants feel as drowsiness or stuffiness, and without records there is nothing to show whether design intent was met.
Reactive call-outs and expensive diagnosis: without trend data, each complaint starts a fresh investigation with ladders, ceiling tiles and portable instruments.
Why Ducts Keep Their Behavior Out of Sight
Ducts hide in ceilings, risers and plant rooms, and several practical factors keep airflow from being measured routinely.
Hard-to-reach locations: the interesting measurement points sit above ceilings or inside mechanical spaces, so each manual reading costs access time and sometimes a permit.
Small signals: duct pressures are low, so the instrument must resolve small differences and stay stable when conditions change.
Constant variation: variable-volume systems and demand-based controls change airflow throughout the day, which makes a single spot check unrepresentative.
Costly wired telemetry: running signal cable through finished ceilings and fire-rated penetrations is slow, disruptive and expensive for a retrofit.
Scattered assets: portfolios often span multiple buildings, each with its own plant, and no one wants a separate wired system in every one.
Dust and moisture in the stream: sensing elements and tubing must tolerate real duct air, not a laboratory, which is why the media compatibility of the instrument matters.
HVAC Airflow Monitoring From Duct Pressure to Dashboard
The path from moving air to a decision has seven links. Each is described below in plain language.
Two Taps, One Pressure Difference
Air moving inside a duct exerts two kinds of pressure. One is the static pressure pushing on the duct walls; the other is the additional pressure created by the moving stream when it meets an opening that faces into it. The difference between them rises and falls with how fast the air travels.
The PDT2 transmitter has a dual-port differential connection, so one port takes the stream-facing tap and the other takes the static tap. For airflow work, Ellenex offers an optional pitot-style airflow kit with the tips and mounting plate needed to present both taps to the duct.
Placing the Probe Where the Stream Is Honest
A pitot tip reads the air that actually reaches it, so its position decides how representative the reading is. General practice is to place it in a straight run, well away from bends, dampers and transitions, where the stream has settled into a regular pattern.
A good location is a compromise between a clean stream and a convenient hole. Trunk ducts, the start of important branches and the return side before a filter bank are common candidates.
From Pressure Difference to Velocity and Volume
The transmitter measures differential pressure with a micro-thermal sensing element, a design chosen for stability at low pressure. The solution reports that pressure along with air velocity in the duct and volumetric airflow, so operators see the quantity they actually care about.
Turning velocity into volume needs only the duct's cross-section, which is entered once when the point is configured on the platform. After that, nobody needs a calculator at the ceiling.
A Zero Reference That Stays Put
Low-pressure sensors are judged by how well they hold zero between visits. The micro-thermal element in the PDT2 is designed for stable zero behavior, which keeps a quiet duct reading as quiet rather than drifting toward a false trend.
The built-in temperature sensor and compensated sensing help keep the reading consistent as the plant room warms and cools. The transmitter is meant for air and other non-conductive, non-corrosive media, which covers ordinary ventilation.
Sampling Rhythm and Battery Budget
Each transmitter runs on a replaceable lithium battery, and its life is rated in readings and transmissions rather than calendar years. Because every reading and every radio message spends charge from the same cell, a point that samples constantly and reports every sample will empty its battery sooner than one that samples regularly but reports only when something changes.
Sampling can be periodic or event-triggered, and transmission can follow each sample, an event or a condition, all configurable from the platform. Duct behavior that is slow and daily calls for a relaxed rhythm; a fault-prone damper may justify a tighter one.
Gateway Route or Direct-to-Tower Route
The PDT2-L sends encrypted LoRaWAN messages to an Ellenex outdoor gateway, which forwards them to the Ellenex Network Server for authentication, decryption and de-duplication. This route needs no SIM and suits a campus or a cluster of plant rooms where one private gateway can cover many points.
The PDT2-N uses NB-IoT or LTE-M and talks straight to a public cellular tower, shipping with a pre-configured SIM. That suits buildings spread across a region, where nobody wants to install a gateway at each one. Our comparison of wired, mechanical and wireless differential pressure options covers the trade-offs in more depth.
What the Platform Does With Each Duct Reading
Readings arrive at the Ellenex Platform, where they are decoded and shown as dashboards, trends and device health views. Operators set high and low thresholds, receive alerts through multiple channels and watch battery status alongside airflow.
The same data can leave the platform through open APIs, webhooks and MQTT forwarding toward SCADA, building management or enterprise systems. Access is role-based, and the mobile app and web login at ellenex.net put the same views in a technician's pocket. The Ellenex mobile app is the quickest way to check a point from the plant room.
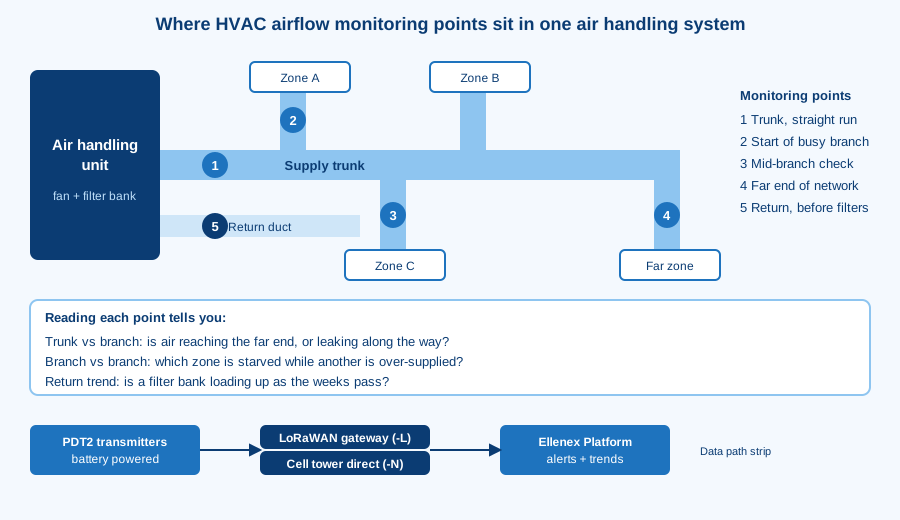
Buildings Where Every Duct Reports for Itself
Once ducts report continuously, daily routines change in several practical ways.
Complaints start with data: a call about a stuffy room begins with a look at that branch's trend, not a ladder.
Filters stop being a calendar chore: loading shows up as a gradual change in airflow, so changes follow evidence.
Balancing becomes verifiable: after a rebalance, the trend confirms whether the new settings held through the week and the next season.
Faults announce themselves: a sudden step in a trunk's airflow reads very differently from a slow filter drift, and thresholds can tell the two apart.
Records exist for audits: logged airflow history gives facilities teams something to show when ventilation performance is questioned.
Remote sites join the picture: a portfolio manager can compare equivalent ducts across buildings without visiting any of them.
Where Duct-Level Data Earns Its Keep
The return on HVAC airflow monitoring is practical rather than speculative. The financial case for IoT implementation page explains how to frame these benefits for budget owners; the categories below describe where they usually appear.
Fewer Ladder Trips and Ceiling-Tile Inspections
Manual airflow checks mean access equipment, time on site and often an out-of-hours window. Continuous reporting replaces most of those visits, leaving technicians for repairs instead of readings.
Fan Energy Spent Only Where Needed
When airflow data shows which branches are over-supplied or starved, operators can trim fan effort and damper positions deliberately. Energy follows measured need rather than a conservative setting nobody revisited.
Filters Changed on Evidence
Airflow trends reveal when a filter bank has loaded enough to matter. Changes can be timed by condition instead of by the calendar, avoiding both early replacements and late ones.
Equipment Shielded From Starved Airflow
Coils, heat exchangers and fans can be damaged or work inefficiently when airflow falls below what they were designed for. Early alerts on falling flow give teams time to intervene before a unit trips or a coil freezes.
Safer Work in Mechanical Spaces
Every measurement taken remotely is one fewer visit to a roof, a riser or a cramped plant room. Fewer visits mean fewer exposures to heights, confined spaces and live equipment.
Rebalancing Planned From Measured Flow
Instead of adjusting dampers by feel, balancing contractors can start from logged behavior and confirm results afterward. Records show whether a fix lasted or drifted back.
Retrofit Costs Held Down Without Cabling
Battery-powered wireless transmitters avoid trenching signal cable through finished spaces. That keeps monitoring practical for older buildings that never had a control point at the duct.
Pairing PDT2-L and PDT2-N With Duct Problems
Ellenex answers each challenge from the earlier sections with a specific capability of the PDT2-L LoRaWAN differential pressure transmitter or the PDT2-N NB-IoT/LTE-M version.
Ducts in Hard-to-Reach Places
Both variants are battery-powered and arrive pre-configured, so installation avoids cable runs and commissioning work at the ceiling. The enclosure is weather-sealed and UV-protected, which also suits rooftop air handlers.
Small Pressures and Quiet Drift
The micro-thermal element resolves the low pressures typical of ducts while holding a stable zero. The PDT2-L and PDT2-N share this sensing design, so the choice between them is about connectivity rather than measurement quality.
Variable Flow Through the Day
Sampling can be periodic or event-triggered. Transmission can follow every sample, an event or a threshold condition, so reporting matches how the duct really moves.
Scattered Buildings and Clustered Plant Rooms
A private LoRaWAN gateway with the PDT2-L suits clustered sites where many ducts are within reach of one gateway, with no carrier data fees on a private network. The PDT2-N suits scattered sites because it connects directly to a cellular tower and needs a carrier subscription, which ships pre-configured.
Handing Data to Existing Systems
Both variants report to the Ellenex Platform, which offers open APIs, webhooks and MQTT forwarding toward building management and SCADA systems. Existing dashboards can stay in use.
Ellenex Airflow Package at a Glance
The Ellenex airflow monitoring solution bundles transmitters, connectivity and platform into one chain from duct to dashboard.
Mechanism: a differential pressure transmitter with a micro-thermal sensing element reads the duct taps, converts the signal into velocity and volumetric airflow, encrypts the payload and sleeps between readings.
Mechanism: the LoRaWAN variant forwards through an Ellenex outdoor gateway and network server, while the cellular variant goes straight to the tower.
Outcome: operators see duct airflow, filter-clogging trends and battery status on one dashboard.
Outcome: configurable thresholds raise alerts when airflow leaves the expected band.
Outcome: logged history supports maintenance planning and ventilation records.
For neighboring problems, see the air filter performance monitoring solution for loaded filters, the cleanroom and critical room pressure monitoring solution for pressurized spaces, and the pressure monitoring in heating and cooling systems solution for hydronic loops.
Feeding Duct Data Into Building Systems
Airflow data is most useful when it lives where operators already look. The Ellenex Platform decodes each message and exposes it through open APIs, webhooks and MQTT forwarding, so duct readings can flow into SCADA, building management and enterprise dashboards.
For a first project, many teams keep the Ellenex dashboard as the working view and forward only alerts and summary values elsewhere. That avoids flooding a control system with every reading while still giving a facilities team one place to review trends.
Data ownership and access also matter in multi-building estates. The platform supports role-based, multi-tenant access, so a contractor can see the ducts they service without seeing the rest of the portfolio. Our BMS and differential pressure article explores integration patterns in more detail.
Tap Care, Zero Checks and Battery Habits
Low-maintenance does not mean no maintenance. The following points are general practice rather than Ellenex procedures.
Keep the taps and tubing clear: inspect them during routine filter changes, since dust or condensation can block a pressure line and mimic a flow change.
Check zero when the fan is off: a stopped system should read flat, and a persistent offset is worth noting before it is mistaken for a trend.
Review sampling after seasonal changes: a rhythm that suits summer cooling may waste battery in a quiet shoulder season.
Watch battery status on the platform: the replaceable cell reports its condition, so swaps can be scheduled with other site visits.
Log every duct change: if a damper is moved or a branch added, note the date so later trends are read in context.
Airflow Facts Replace Airflow Folklore
Buildings that measure duct airflow stop arguing about whether rooms are under-served and start fixing the specific branch or filter responsible. Complaints resolve faster, fans run for reasons, and ventilation records exist when someone asks for them. The same data supports capital planning, because patterns across seasons show which air handlers are close to their limits.
Frequently Asked Questions
Can a wireless sensor measure airflow in a duct without a big opening?
Yes. Pressure taps need only small penetrations, and the transmitter itself mounts outside the duct on a short run of tubing. The optional pitot-style airflow kit supplies the tips and plate for that arrangement.
General practice is to seal every penetration properly so the duct's pressure integrity is unaffected. The enclosure and sensor assembly are designed for the plant room and for outdoor locations.
How often should a transmitter report in a variable-volume system?
It depends on how fast the duct changes and how quickly someone must react. For slow daily patterns, a relaxed rhythm is enough; for dampers or fans that cycle quickly, a tighter one helps.
Both variants allow periodic or event-triggered sampling and a choice of transmission conditions. Because battery life is rated in readings and transmissions, a conditional approach often gives rich data without frequent radio traffic.
What happens to the readings when a filter loads up between visits?
Airflow in the affected duct drifts as resistance rises, and the trend shows a steady shift instead of a sudden step. Operators can set thresholds that warn before the change becomes a comfort problem.
That slow shape also separates filter loading from a damper failure or breach, which usually looks abrupt. Watching the shape of the line is often more informative than any single value.
Does continuous monitoring replace a balancing report?
No. A balancing report establishes design-intent flows at a point in time, and monitoring confirms whether those flows hold afterward. The two complement each other.
After a rebalance, the logged trend becomes the proof that settings stayed put. If they drift, the history shows when and roughly why.
Which connectivity route suits ducts spread across several sites?
Cellular suits scattered sites best, because the PDT2-N reaches a public tower directly and needs no gateway on each property. A campus with many plant rooms close together can instead use the PDT2-L through one private gateway.
Mixed estates can run both on the same platform. Read the LoRaWAN and NB-IoT/LTE-M explainers for the coverage factors that matter.
Where should the pressure taps sit relative to bends and dampers?
General practice is to choose a straight, undisturbed run with generous distance before and after bends, dampers and transitions. Readings taken right beside a disturbance swing with turbulence and can mislead.
If a perfect location does not exist, consistency matters more than perfection: a repeatable position gives trends that remain comparable over time.
Can duct airflow data reach an existing building management system?
Yes, through the Ellenex Platform's open APIs, webhooks and MQTT forwarding. Teams often forward only alerts and summaries, keeping the full history on the platform.
The platform also offers white-label and role-based access options. Your integrator can confirm which pathway fits your control system.
Related Reading
Masters of the Breeze: Airflow monitoring and negative pressure monitoring in hospitals: how airflow direction and pressure protect patients in hospital HVAC systems.
Why the Next Generation of BMS Needs Smarter Differential Pressure Sensors: the case for wireless differential pressure sensing in building controls.
Differential Pressure Sensing in HVAC: mechanical gauges, wired transmitters and wireless options compared.
Monitoring Positive Pressure in Clean Rooms: pressure monitoring for controlled environments.
Useful Links
Talk to Ellenex
When the next comfort complaint arrives, the useful question is what the duct was doing an hour earlier. If you would like data to answer it, describe your air handlers and any infrastructure monitoring you already run on the Ellenex sales inquiry page, and the team will suggest a starting layout.


